> ## Documentation Index
> Fetch the complete documentation index at: https://docs.llumo.ai/llms.txt
> Use this file to discover all available pages before exploring further.
# Observe
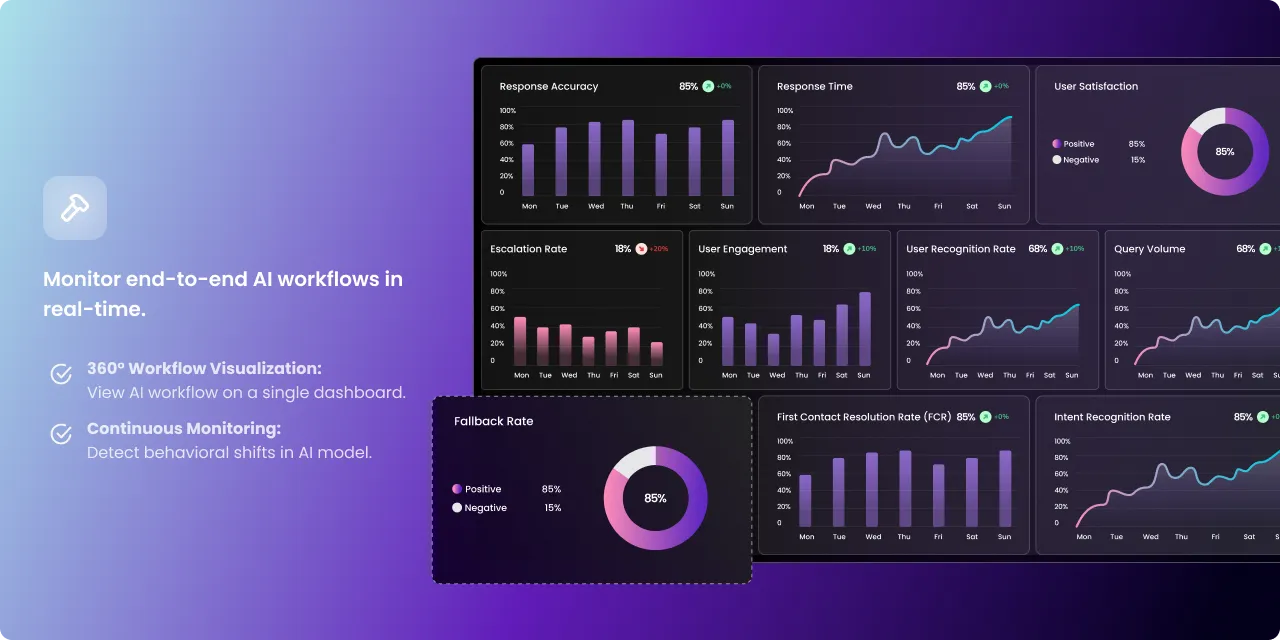
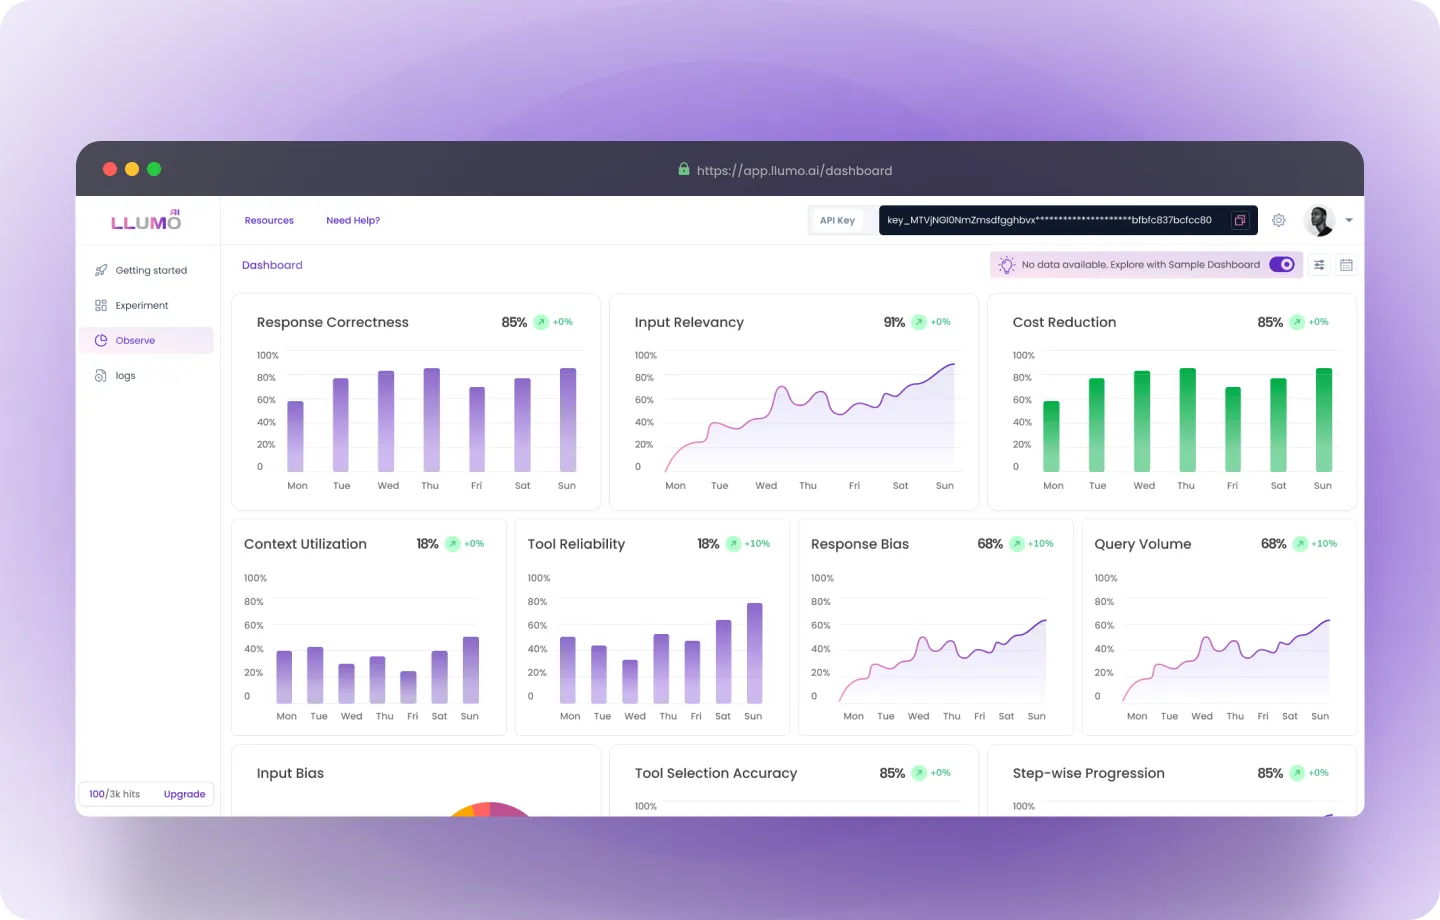
LLUMO AI Observe is a dashboard designed to monitor 360° LLM performance in real time. By providing an in-depth view of each and every point across your LLM workflow, Observe helps businesses to visualize the performance of AI workflows and helps to pin point the exact issues.
 ***
## Why You Need LLUMO AI Observe
If you often struggle with:
* **Lack of Visibility** – No clear insights on how your LLM workflows
* **Inconsistency** – Unpredictable responses due to unmonitored model drifts.
* **Scalability** – Performance degrades as queries increase.
* **High AI costs** – Inefficient prompts and excessive API calls drive up expenses.
* **Output Quality** – No structured way to track biases, hallucinations, or security issues.
***
## Core Features
### 360° LLM Monitoring Dashboard
Track LLM responses in real time with a unified dashboard that visualizes performance trends, failure points, and cost breakdowns.
### End-to-End LLM Pipeline Visibility
Observe how inputs are processed at each stage, ensuring transparent and predictable AI behavior.
### Cost Optimization & Resource Efficiency
Reduce AI operational expenses by tracking token usage, identifying redundant API calls, and optimizing prompt efficiency.
***
## Exploring the LLUMO AI Observe Dashboard
The LLUMO AI Observe dashboard provides a real-time snapshot of LLM performance. Key widgets include:
***
## Why You Need LLUMO AI Observe
If you often struggle with:
* **Lack of Visibility** – No clear insights on how your LLM workflows
* **Inconsistency** – Unpredictable responses due to unmonitored model drifts.
* **Scalability** – Performance degrades as queries increase.
* **High AI costs** – Inefficient prompts and excessive API calls drive up expenses.
* **Output Quality** – No structured way to track biases, hallucinations, or security issues.
***
## Core Features
### 360° LLM Monitoring Dashboard
Track LLM responses in real time with a unified dashboard that visualizes performance trends, failure points, and cost breakdowns.
### End-to-End LLM Pipeline Visibility
Observe how inputs are processed at each stage, ensuring transparent and predictable AI behavior.
### Cost Optimization & Resource Efficiency
Reduce AI operational expenses by tracking token usage, identifying redundant API calls, and optimizing prompt efficiency.
***
## Exploring the LLUMO AI Observe Dashboard
The LLUMO AI Observe dashboard provides a real-time snapshot of LLM performance. Key widgets include:
 * **Response Accuracy** → Tracks the correctness and reliability of AI-generated responses. A higher accuracy indicates fewer hallucinations and better AI performance.
* **Response Time** → Measures the latency of AI responses. Faster response times enhance user experience, especially for real-time applications like chatbots and AI assistants.
* **User Satisfaction** → Displays positive vs. negative feedback from users interacting with the AI. A high satisfaction rate suggests effective and useful AI responses.
* **User Engagement** → Measures how actively users interact with the AI, reflecting adoption and usability. A percentage increase shows growing engagement.
* **Escalation Rate** → Indicates how often AI fails to resolve queries, leading to human intervention. A lower percentage is desirable. The percentage increase suggests potential performance issues.
* **Fallback Rate** → Tracks how often the AI fails to generate a meaningful response and falls back to predefined responses. High fallback rates may indicate incomplete training or ineffective prompt engineering.
* **Query Volume** → Monitors AI usage trends. An increased percentage suggests growing adoption or increased demand for AI interactions.
* **User Recognition Rate** → Measures how well the AI identifies returning users or understands user queries. An improvement percentage signals better personalization and recognition.
* **First Contact Resolution** → Measures how effectively AI resolves queries in the first interaction without requiring follow-ups. A higher FCR boosts efficiency.
* **Intent Recognition Rate** → Evaluates how well AI understands user intent. A high rate suggests strong NLP capabilities and effective intent classification.
* **Conversation Completion Rate** → Shows how many AI-driven conversations reach a natural resolution. A declining rate may indicate users dropping off due to poor responses.
* **Sentiment Analysis** → Analyzes the sentiment of AI-generated responses and user feedback. Helps in identifying areas of improvement.
* **Hallucination Rate** → Tracks how often the AI generates inaccurate or misleading responses. Lower rates indicate higher reliability. A positive trend suggests ongoing improvements.
***
## How to Start with LLUMO AI Observe
### Step 1: Log Your Observations
Integrate LLUMO AI Observe into your system to track live model interactions. Define critical monitoring metrics such as latency, accuracy, and hallucination rates.
### Step 2: Analyze Performance Trends
Click on the LLUMO Observe button to see real-time visualization, pinpoint failures, identify efficiency gaps, and analyze model drift over time.
SETUP OBSERVE
***
## FAQ
**Q. What is LLUMO AI Observe?**\
LLUMO AI Observe is a real-time monitoring platform that helps teams track, analyze, and optimize their LLM applications across an entire pipeline.
**Q. How does LLUMO AI Observe improve LLM performance?**\
It provides:
* Live dashboards for tracking performance trends.
* Anomaly detection to prevent model drift.
* Cost optimization insights to improve efficiency.
**Q. What monitoring metrics are available in LLUMO AI Observe?**
* **Prebuilt Metrics:** Latency, accuracy, hallucination rate, API cost.
* **Custom Metrics:** Define KPIs based on specific use cases.
**Q. Can LLUMO AI Observe help reduce AI costs?**\
Yes! It tracks token usage, API expenses, and inefficient prompts to lower operational costs.
**Q. How can I track model performance over time?**\
LLUMO AI Observe logs all monitoring data, allowing users to compare trends and fine-tune their AI models continuously.
API DOCUMENTATION
* **Response Accuracy** → Tracks the correctness and reliability of AI-generated responses. A higher accuracy indicates fewer hallucinations and better AI performance.
* **Response Time** → Measures the latency of AI responses. Faster response times enhance user experience, especially for real-time applications like chatbots and AI assistants.
* **User Satisfaction** → Displays positive vs. negative feedback from users interacting with the AI. A high satisfaction rate suggests effective and useful AI responses.
* **User Engagement** → Measures how actively users interact with the AI, reflecting adoption and usability. A percentage increase shows growing engagement.
* **Escalation Rate** → Indicates how often AI fails to resolve queries, leading to human intervention. A lower percentage is desirable. The percentage increase suggests potential performance issues.
* **Fallback Rate** → Tracks how often the AI fails to generate a meaningful response and falls back to predefined responses. High fallback rates may indicate incomplete training or ineffective prompt engineering.
* **Query Volume** → Monitors AI usage trends. An increased percentage suggests growing adoption or increased demand for AI interactions.
* **User Recognition Rate** → Measures how well the AI identifies returning users or understands user queries. An improvement percentage signals better personalization and recognition.
* **First Contact Resolution** → Measures how effectively AI resolves queries in the first interaction without requiring follow-ups. A higher FCR boosts efficiency.
* **Intent Recognition Rate** → Evaluates how well AI understands user intent. A high rate suggests strong NLP capabilities and effective intent classification.
* **Conversation Completion Rate** → Shows how many AI-driven conversations reach a natural resolution. A declining rate may indicate users dropping off due to poor responses.
* **Sentiment Analysis** → Analyzes the sentiment of AI-generated responses and user feedback. Helps in identifying areas of improvement.
* **Hallucination Rate** → Tracks how often the AI generates inaccurate or misleading responses. Lower rates indicate higher reliability. A positive trend suggests ongoing improvements.
***
## How to Start with LLUMO AI Observe
### Step 1: Log Your Observations
Integrate LLUMO AI Observe into your system to track live model interactions. Define critical monitoring metrics such as latency, accuracy, and hallucination rates.
### Step 2: Analyze Performance Trends
Click on the LLUMO Observe button to see real-time visualization, pinpoint failures, identify efficiency gaps, and analyze model drift over time.
SETUP OBSERVE
***
## FAQ
**Q. What is LLUMO AI Observe?**\
LLUMO AI Observe is a real-time monitoring platform that helps teams track, analyze, and optimize their LLM applications across an entire pipeline.
**Q. How does LLUMO AI Observe improve LLM performance?**\
It provides:
* Live dashboards for tracking performance trends.
* Anomaly detection to prevent model drift.
* Cost optimization insights to improve efficiency.
**Q. What monitoring metrics are available in LLUMO AI Observe?**
* **Prebuilt Metrics:** Latency, accuracy, hallucination rate, API cost.
* **Custom Metrics:** Define KPIs based on specific use cases.
**Q. Can LLUMO AI Observe help reduce AI costs?**\
Yes! It tracks token usage, API expenses, and inefficient prompts to lower operational costs.
**Q. How can I track model performance over time?**\
LLUMO AI Observe logs all monitoring data, allowing users to compare trends and fine-tune their AI models continuously.
API DOCUMENTATION