Prerequisites
Before you begin, make sure that:- You have an active LLUMO AI account and access to the platform.
- You have the necessary datasets and evaluation metrics defined for your AI models.
- Make sure you have a working understanding of API integration or access to the user interface (UI) on your platform—check out our LLUMO AI guide on API to get started.
Step 1: Log In to LLUMO AI
- Sign in to your LLUMO AI account here using your credentials.
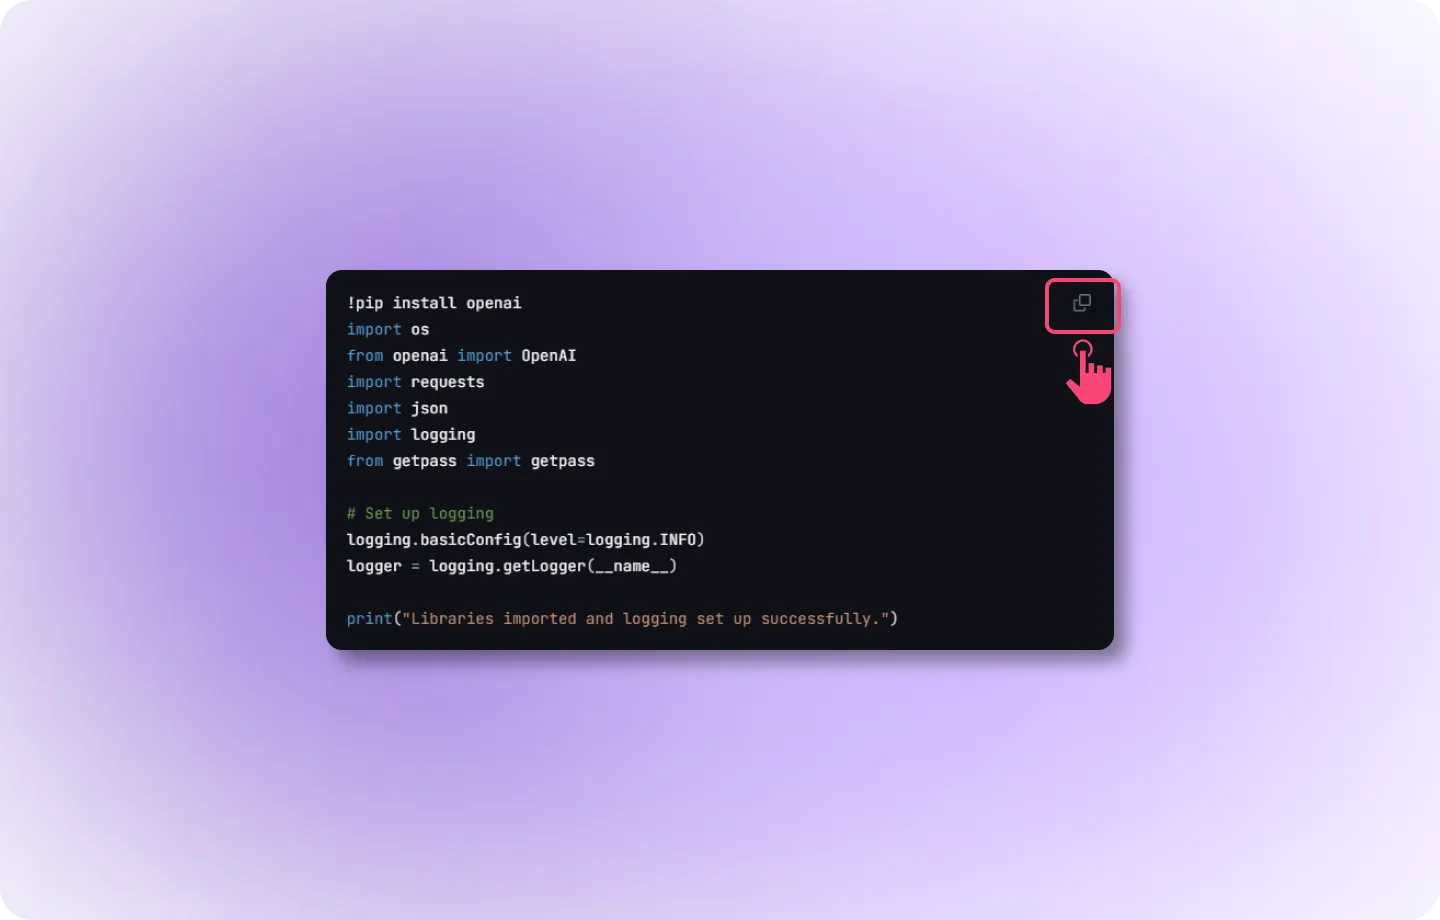
- Navigate to the “Eval LM” section and go to “Connect API” where you can start the evaluation process for your AI model.
- Now, copy the code and set up prompt evaluation API in your codebase.
Step 2: Hit the API for Evaluation
In a production environment, you need to send requests to the evaluation API. This is where the evaluation of your text, image, or other data happens.- API Call: You’ll be sending a request to the API endpoint with the required data (e.g., prompts, outputs).
- Request Type: This is done via a POST request with a JSON payload.
- Endpoint: https://app.llumo.ai/create-eval-api
Step 3: Production Code Execution
Once the API receives the request, it processes the input data and returns metrics like confidence, clarity, and context. These metrics will be used to analyze the output.- API Output: Metrics such as confidence, clarity, context, and overall score are generated by the API.
- These responses from the API can be used in your own production code as well. Further, these are logged at LLUMO’s end, which you can access in the “Logs” section.
Step 4: View Logs in Real-Time
In a production environment, all the API responses and metrics can be logged in real-time to keep track of performance and behavior.Step 5: Real-Time Analysis Using a Dashboard
 A dashboard interface for LLUMO AI’s evaluation and monitoring system. Below is a detailed explanation of both screens:
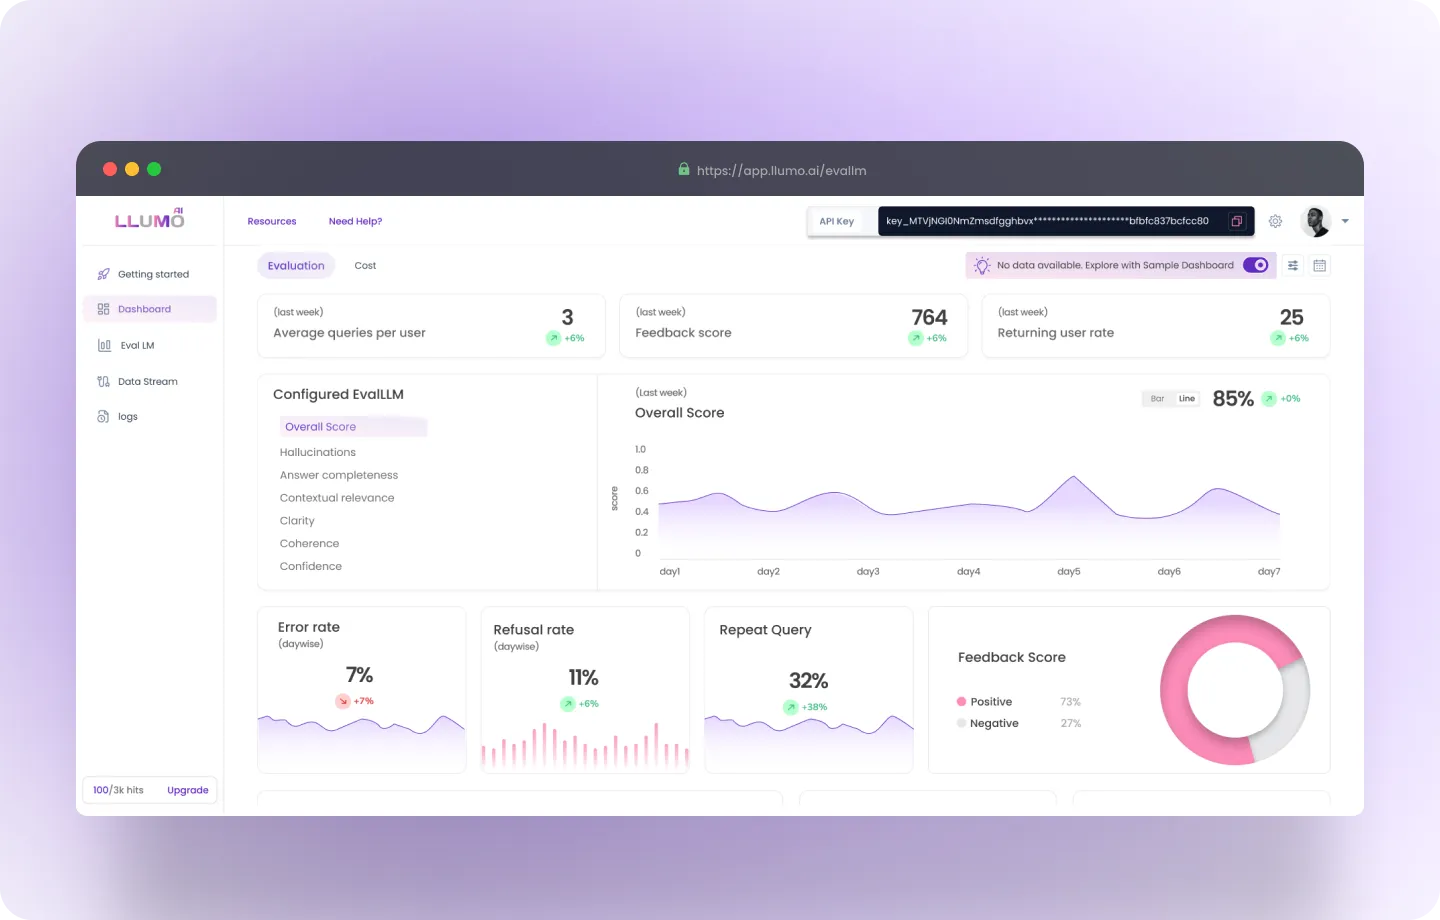
Screen 1: Evaluation Dashboard Overview
Key Metrics Displayed
-
Average Queries per User (Top Left)
- Indicates the average number of queries submitted by individual users over the selected timeframe (e.g., December 2024).
- Current Value: 3 (with a 3% decline compared to the previous period).
- Use Case: Helps track user engagement levels.
-
Tokens per Query (Top Center)
- Displays the average token usage for each query.
- Current Value: 764 (8% reduction compared to the prior period).
- Use Case: Useful for managing token efficiency and optimizing costs.
-
Returning Users Rate (Top Right)
- Shows the percentage of users who return to use the platform.
- Current Value: 25% (4% improvement).
- Use Case: A higher rate indicates better user retention and satisfaction.
-
Overall Quality Score (Right Center)
- Represents the aggregate quality score for the model’s performance.
- Current Value: 85% (2% increase).
- Graph: Provides a trend analysis of quality over time, enabling performance monitoring.
Detailed Metrics
-
Error Rate
- Measures error rates to assess AI performance.
- Current Value: 7% (reduced by 3%).
- Use Case: Lower score indicates better AI output and robust LLM pipeline.
-
Refusal Rate
- Measures refusal rates to understand rejection trends.
- Current Value: 6% (reduced by 12%).
- Use Case: Lower score indicates better AI output and fewer declines to generate a response.
-
Repeat Query
- Measures the frequency of repeated queries.
- Current Value: 32% (increased by 8%).
- Use Case: Lower score indicates a more effective response.
-
Feedback Score
- Measures the quality of your interactions.
- Current Value: Positive (73%) vs. Negative (27%).
- Use Case: Provides qualitative insight into user satisfaction.
Additional Metrics
-
Model-Wise Error & Refusal Rates
- Breaks down performance metrics across different models (e.g., GPT-4, Gemini-Pro).
- Use Case: Measure performance by analyzing error and refusal rates per model.
-
Completion Rate Per Task
- Visualizes how well the system performs across distinct task categories (e.g., “Can”, “Do”).
- Use Case: Measure completion rate per task to gauge efficiency.
Screen 2: Evaluation and Insights
Evaluation Section
-
Error and Refusal Rate Comparisons Across Models
- Models include GPT-3.5 Turbo, GPT-4, Gemini-Pro, and custom solutions.
- Graphs compare error rates (e.g., some errors that don’t lead to any response) and refusal rates (e.g., queries declined by models).
- Use Case: Model benchmarking to identify the most effective system.
-
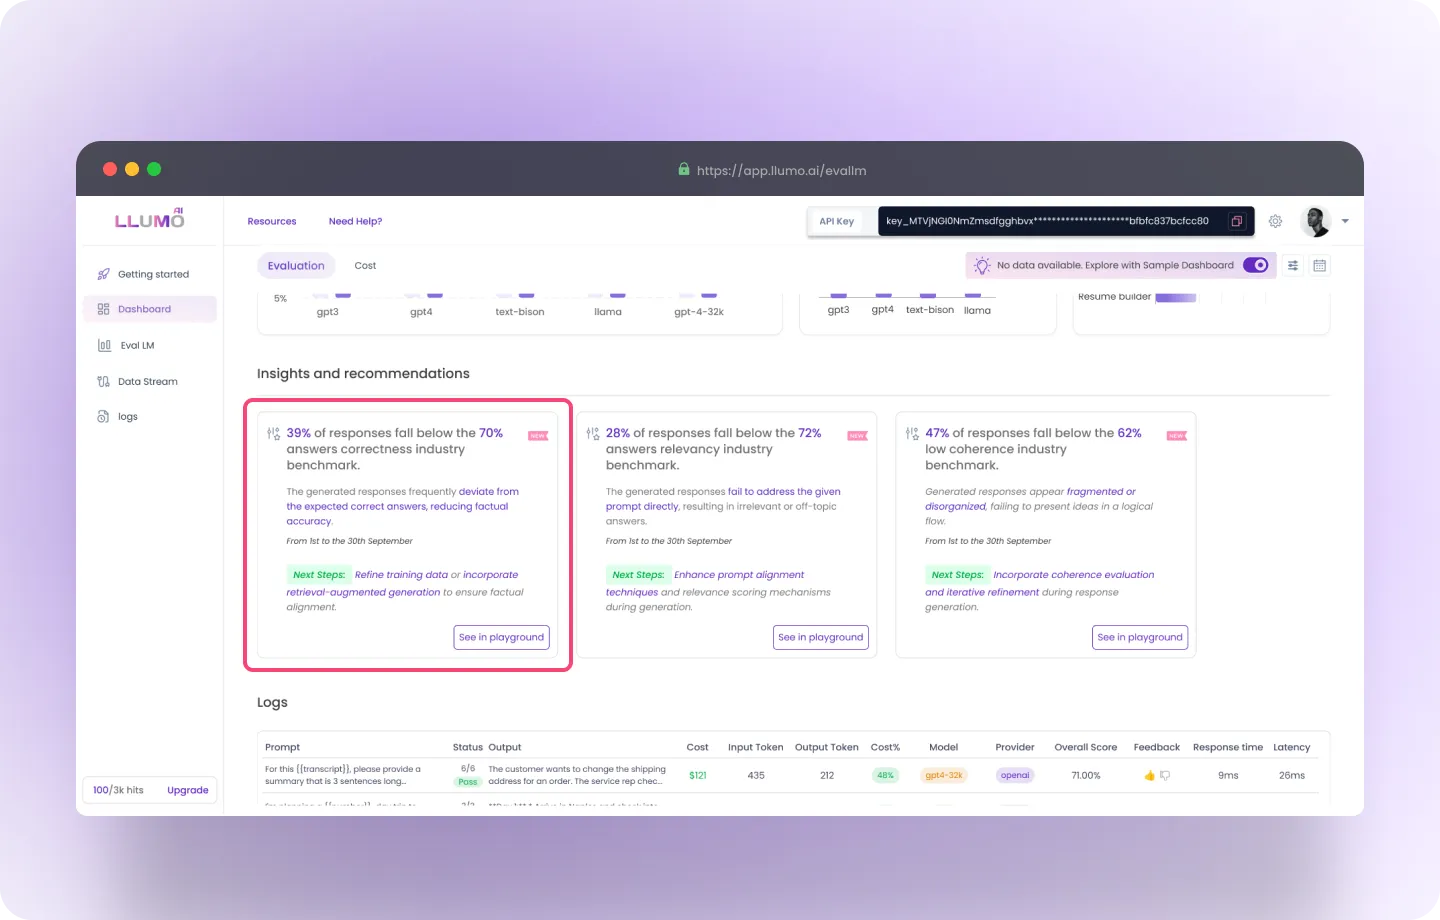
Insights and Recommendations
- The insights highlight areas of concern in the generated responses and compare them to industry benchmarks.
- Metrics: A percentage of responses falling below the respective benchmark for correctness (70%), relevancy (72%), and coherence (62%).
- Time Period: Data is drawn from 1st to 30th September, providing a specific evaluation period.
- “See in Playground” Buttons: These buttons suggest the ability to test or refine model outputs interactively, providing an actionable follow-up for users.
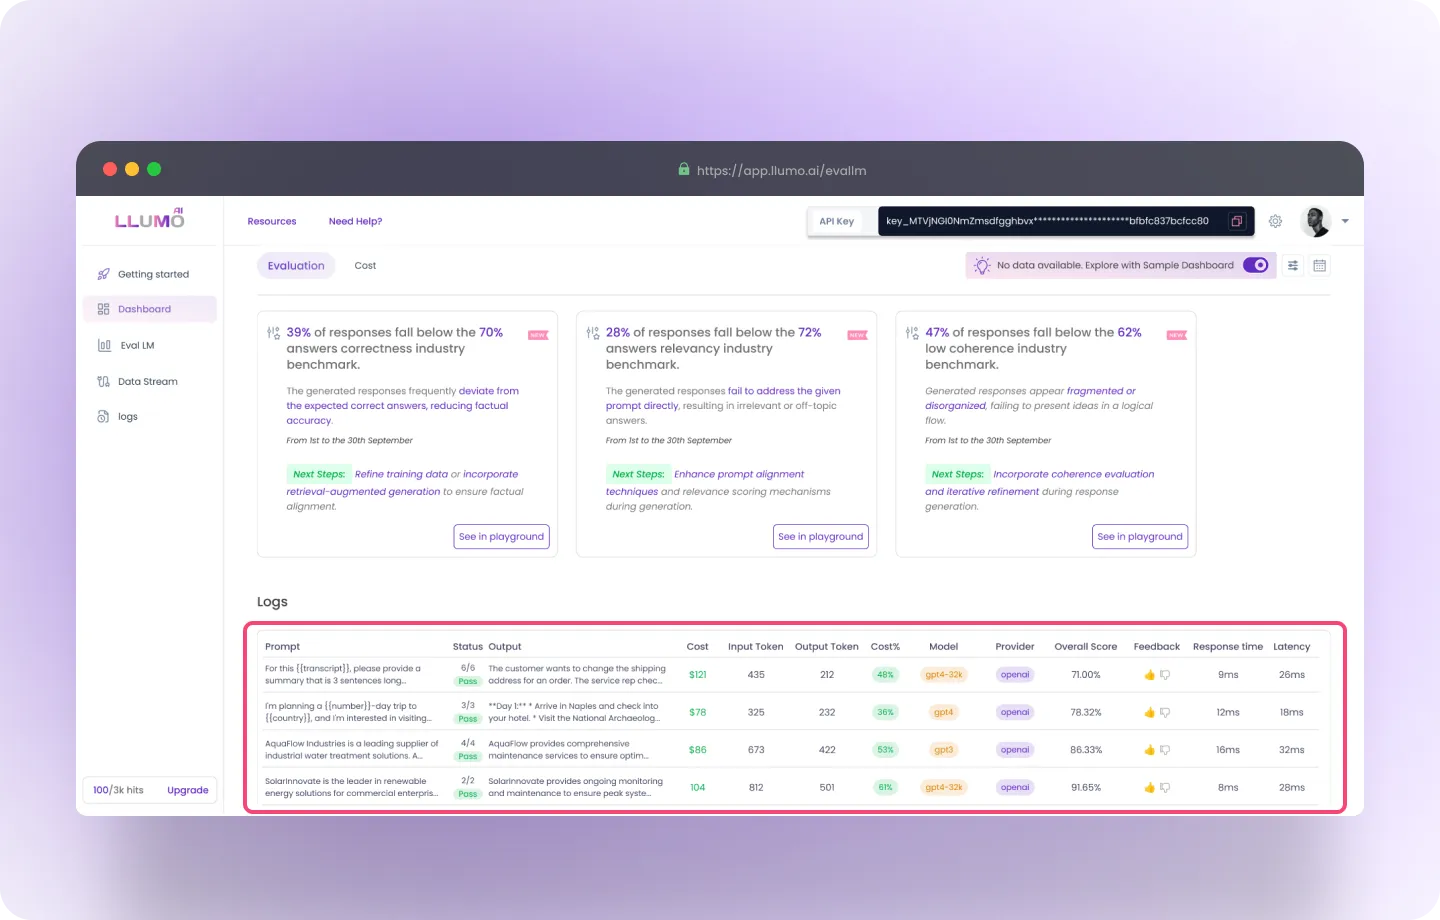
Log Section
Logged Queries Table
Fields:- Prompt: User-submitted input or request.
- Output: Model’s response to the prompt.
- Model: Name of the model used to generate the output.
- Provider: Indicates the service provider (e.g., OpenAI, VertexAI).
- Input/Output Tokens: Number of tokens in the query and response.
- Total Tokens: Combined tokens used (input + output).
- Response Time: Time taken to generate a response.
 Running evaluation in production is an essential step to ensure your AI models perform well in real-world situations. Over time, models can lose accuracy due to changes in data or user behavior, but with LLUMO AI, you can easily monitor and improve your model’s performance. By following the steps outlined in this guide, you can identify issues quickly, make improvements, and keep your AI systems running effectively. LLUMO AI makes this process simple with its user-friendly tools, detailed metrics, and automation options, helping you maintain reliable and high-quality AI models.